TL;DR What This Guide Covers
- GA4 tracks how users behave on your site, including predictive metrics most businesses ignore.
- GTM controls what data gets captured in the first place, and without it, your analytics have holes.
- Google Search Console shows how Google sees you and where your search traffic is leaking.
- Google Business Profile captures local demand signals that often outperform paid ads in conversion rate.
- Used separately, these tools give you data. Integrated, they give you direction.
- Most businesses are making costly mistakes, broken tags, vanity metrics, and data silos that this guide directly addresses.
If you run a business with a website, you almost certainly have analytics installed. Google Analytics 4 or something like it is firing on every page load. Numbers are being recorded. Dashboards exist. Maybe someone checks them once a month.
And yet, for most businesses, that data does absolutely nothing.
The fundamental problem with analytics in 2026 isn't access to data. It's the gap between collecting data and acting on it. Traffic. Sessions. Impressions. These numbers feel reassuring to track. They make for tidy monthly reports. But they don't answer the one question that actually drives growth: what should we do next?
At c3digitus, we've spent years watching businesses mistake reporting for strategy and fixing the damage that follows. This guide is our attempt to close that gap. Not with generic tips, but with a clear framework: four tools, one integrated feedback loop, and a real system for turning data into decisions.

- 60% of search queries in 2026 result in zero clicks users get answers on the SERP itself. Traffic-only tracking misses all of this.
- 25% of GA4 setups have significant data gaps caused by broken tags or misconfigured consent modes. (Data gaps in GA4 implementations can actually range from 10% to 50% depending on the specific cause and configuration.)
- 3-9× greater annual growth for companies that integrate cross-channel data vs. those running analytics in silos.
- Businesses failing to implement Google Consent Mode v2 report a 40%+ gap in measurable conversions due to user opt-outs, a setup that is now mandatory in 2026 for legal and technical compliance.
GA4: Understanding What Users Actually Do, Not Just That They Showed Up
The migration from Universal Analytics to GA4 wasn't just a platform upgrade. It was a philosophical shift from tracking sessions and pageviews to tracking behavior and intent. If you're still thinking about GA4 the way you thought about UA, you're missing most of its value.
Everything Is an Event Now, and That Changes Everything
In GA4, the fundamental unit of measurement is the event. Every action a user takes, loading a page, scrolling past the 90% mark, starting a video, clicking a CTA, or completing a purchase, is logged as an event with its own set of parameters. This creates something UA never had: a unified behavioral model.
Why does this matter practically? Because it forces you to think about what users do, not just where they go. Consider this: if 1,000 users visit your product page, 800 scroll past the fold, 200 click your CTA, and only 20 convert, the insight isn't "we need more traffic." The insight is:
- Why did 600 of the 800 scrollers not click?
- What happened between the CTA click and the conversion that caused 180 people to drop?
- What's different about the 20 who actually converted?
GA4's Path Exploration and Funnel Analysis reports answer these questions directly, but only if you've configured your events to capture them in the first place.
Predictive Metrics: The Feature 90% of Businesses Leave Untouched
GA4 uses machine learning to generate predictive audience scores for your users. The two most valuable:
Purchase Probability: the likelihood that a specific user will purchase in the next 7 days, based on their behavior patterns compared to historical converters.
Churn Probability: the likelihood that an active user will stop engaging with your site in the next 7 days.
Businesses that build retargeting audiences around these predictive scores consistently report 20–30% improvements in media efficiency. You're no longer spending ad budget on showing generic retargeting ads to everyone who visited your site. You're targeting the people the data says are about to buy.
Most businesses never activate this. That's a competitive advantage sitting on the table unclaimed.
⚠ Critical Setup Note: GA4 defaults to a 14-month data retention window for event data. After your second year, Year-over-Year comparisons become impossible unless you've linked GA4 to BigQuery. This is a one-time configuration step that lets you store your historical data indefinitely. It should be part of every GA4 setup from day one.
GTM: The Data Control Layer That Makes Everything Else Reliable
Here's a truth most analytics guides don't say clearly enough: GA4 is only as accurate as the data feeding it. And the system that controls what data gets collected, when, and how is Google Tag Manager.
Think of GTM as the nervous system of your analytics stack. GA4 is the brain that processes signals. GTM is the network that decides which signals get sent.
What GTM Lets You Track That Standard Analytics Misses
Standard GA4, without GTM configuration, captures pageviews and some basic scroll events. GTM is what unlocks the behavioral layer:
- Form interactions not just submissions, but when someone starts filling out a form and abandons it
- Button-level click tracking to determine which specific CTAs are performing, and which ones users ignore
- Scroll depth is exactly how far users get through long-form content before they leave.
- Video engagement, whether users actually watch your explainer video or skip past it
- Hover intent when users mouse over an element but don't click (a signal of hesitation)
- Abandoned actions checkout steps started but were not completed
This is where conversion optimization happens. Not in the headline A/B test. The behavioral microdata shows you exactly where users hesitate and disengage.
The Data Layer: GTM's Most Underrated Component
The data layer is a JavaScript object that sits between your website and your tracking tools. It's the structured pipeline through which your CMS, e-commerce platform, or CRM passes information to GA4, ad platforms, and other tools.
A clean, well-structured data layer means:
- Consistent, accurate data across all platforms
- Faster page load times (fewer client-side scripts firing independently)
- Scalable tracking that doesn't require a developer every time something new needs to be measured
A messy or missing data layer is the hidden cause of more bad business decisions than almost any other technical issue. You get inaccurate attribution, broken funnel analysis, and ad campaigns optimizing toward the wrong signals.
Performance note: Server-Side GTM, where tag management moves from the user's browser to a server you control, can meaningfully improve Core Web Vitals by reducing the volume of client-side scripts. Since page speed is a direct ranking factor, this is one of the rare technical setups that improves both your analytics accuracy and your SEO.
Google Search Console: Reading How Google Actually Sees Your Website
GA4 tells you what users do after they arrive. GSC tells you what happened before how they found you, what they searched for, and whether Google could even find your pages in the first place.
These are different questions. Both matter. And most businesses only answer one of them.
The Indexing Reality Check Nobody Talks About
One of the most jarring GSC discoveries for businesses doing a proper audit: they believe they have 500 pages indexed. GSC shows that only 200–300 of them actually are. That gap pages Google can't or won't index is invisible traffic, invisible rankings, and invisible revenue.
GSC's Coverage report tells you exactly which pages are indexed, which are excluded and why, and which have crawl errors that need fixing. For most sites that haven't done a recent technical audit, this is the fastest source of recoverable SEO value available.

If you want a clear picture of where your site stands today, an SEO audit report is the logical starting point, as it surfaces exactly these indexing gaps alongside the technical fixes that have the biggest impact.
The Fastest Win in SEO That Most People Ignore
Here's a scenario that happens constantly: a page ranks in position 2 or 3 for a valuable keyword. It gets thousands of impressions every month. The click-through rate is 1.4%.
The instinct is to push for a higher ranking. But the actual problem is the snippet. The title tag isn't answering what the searcher actually wants. The meta description doesn't create a reason to click. Someone three positions below is writing a more compelling snippet and getting significantly more traffic despite the lower rank.
In 2026, the #1 organic position captures roughly 35% of clicks on average, but only when the intent match is right. GSC makes it easy to identify these pages: filter by deep impressions, low CTR. Rewrite the meta titles and descriptions to match search intent more precisely. This is one of the highest-ROI changes you can make to an existing site with zero new content created.
Core Web Vitals: Where UX and Rankings Intersect
GSC's Core Web Vitals report shows how Google evaluates your site's user experience across three dimensions:
- LCP (Largest Contentful Paint): how fast the main content loads
- INP (Interaction to Next Paint): how quickly the page responds to user input
- CLS (Cumulative Layout Shift) measures whether page elements jump around as the page loads
Poor Core Web Vitals don't just frustrate users; they directly suppress rankings. Google has been explicit that these signals factor into search ranking decisions. Sites that score well here get a measurable lift compared to competitors who ignore it.
Google Business Profile: Where Local Intent Converts Faster Than Any Ad Campaign
For any business with a physical presence, a service area, or a local customer base, Google Business Profile (GMB) is not a secondary tool. It is often the highest-converting traffic source you have.
And most businesses treat it like an afterthought.
What GMB Analytics Actually Tells You
GMB's insights panel surfaces data that no other tool captures:
- Discovery searches vs. branded searches: Are people finding you because they searched for your name, or because they searched for a category you appear in? This tells you whether your local visibility is growing.
- Direction requests a direct signal of physical visit intent.
- Phone calls initiated from the profile of high-intent local leads who haven't visited your website at all
- Photo views and engagement, whether your visual content is actively driving interest
These aren't vanity metrics. Each one represents a person who was already close to a decision when they found you.
Why GMB Often Outperforms Your Website in Conversion Rate
Local searchers, people typing "near me" or searching for a service in a specific city, are typically much further along in the buying decision than a general organic visitor. They're not researching. They're choosing. Studies consistently show that users arriving from local search are 50%+ more likely to convert within the same hour compared to general website visitors.
If your GMB profile is generating more calls and direction requests than your website is generating leads, that's not a problem with your GMB. It's useful diagnostic information: your local discoverability is working, but your website's conversion UX isn't keeping pace. That's a specific, fixable problem, not a vague "traffic issue."
What Keeps GMB Performing Well Over Time
GMB is not a set-it-and-forget-it tool. Google treats active, frequently-updated profiles as signals of a legitimately operating business. The practices that consistently drive stronger local rankings and engagement:
- Posting regular updates (offers, news, behind-the-scenes content)
- Responding to every review, positive and negative
- Keeping photos current and high-quality
- Maintaining consistent NAP (name, address, phone) information across the web
- Answering questions in the Q&A section before users have to ask them
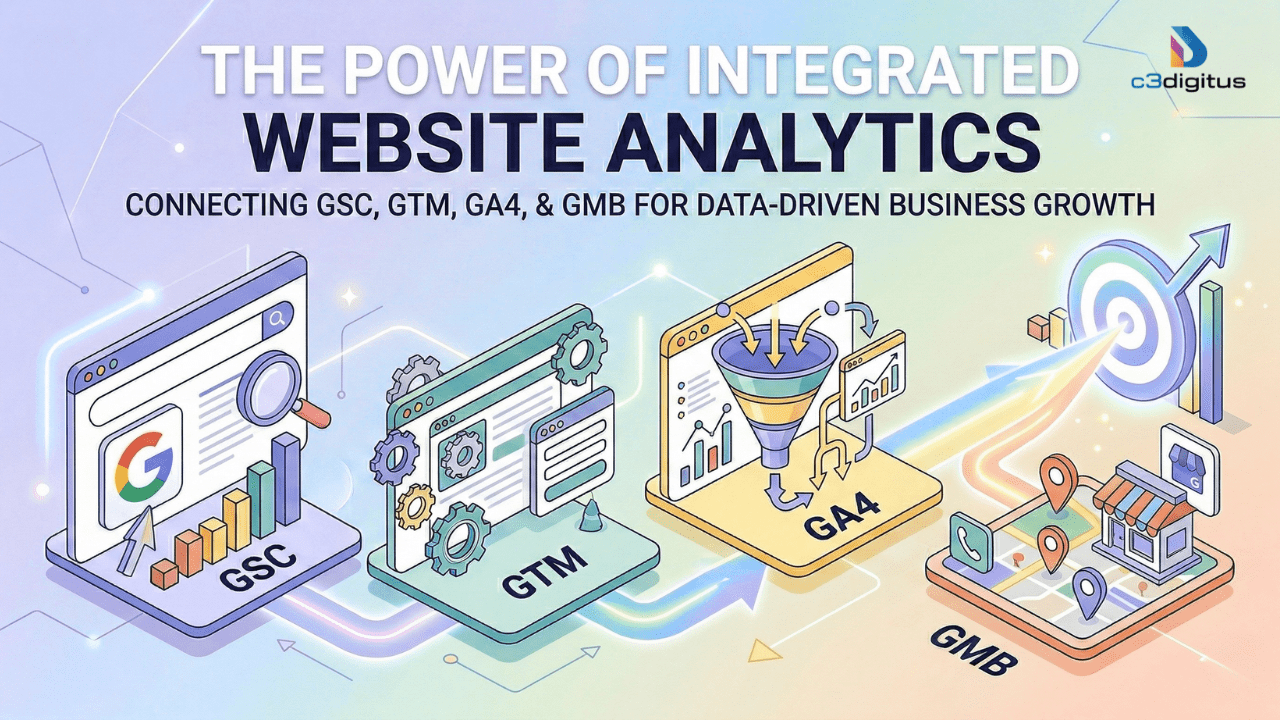
The Real Power: What Happens When You Use All Four Together
Here is where most analytics guides stop short. They explain what each tool does. They don't explain what happens when you connect them, which is where the actual competitive advantage lives.

Step 1 GSC
Identify a keyword where you have 8,000 monthly impressions but only a 1.2% CTR. The traffic potential is there. Something's blocking it.
Step 2 GA4
The users who do click land on that page and bounce within 20 seconds. Path Exploration shows they're leaving directly, not exploring further. Intent mismatch confirmed.
Step 3 GTM
GTM data shows the CTA button on that page has a 3% click rate. Of those who click, the form completion rate is 11%. The bottleneck is the page content, not the form.
Step 4 GMB
GMB shows strong local search discovery for the same service category. Local intent is real and growing. The opportunity is validated. Time to fix the page.
That's not four separate data points. That's a decision. Without the integration, each tool gives you a fragment. Together, they give you a complete picture and a clear next action.
"The difference between a business that grows and one that guesses often isn't budget, talent, or even strategy. It's whether their analytics is actually talking to them or just collecting dust in a tab no one opens."
If you want to see how this integration works in practice as part of a broader visibility strategy, the Visibility Hero framework at c3digitus is built around exactly this kind of connected thinking, where search visibility, user behavior, and local signals reinforce each other rather than operating in separate silos.
The 5 Analytics Mistakes That Are Quietly Costing You Growth
Collecting data is easy. Extracting intelligence from it is the hard part. Most businesses fall into predictable patterns that undermine the value of their analytics setup. Here are the five most damaging, ranked by their real-world impact on ROI.
HIGH PRIORITY
1. Tracking Vanity Metrics Instead of Value Metrics
Sessions and pageviews feel meaningful because they're easy to track. But in a world where 60% of searches now result in zero clicks, users getting their answers directly on Google's results page, traffic-only reporting misses an enormous portion of your actual brand exposure and influence.
Fact: Businesses that focus on Conversion Rate per Traffic Source see approximately 30% higher ROI than those focused on raw traffic volume.
HIGH PRIORITY
2. The "Set It and Forget It" Trap
Tracking configurations break. Website updates, CMS changes, and plugin conflicts silently corrupt your data. A GA4 setup that was perfectly configured 18 months ago may be producing significantly inaccurate numbers today, and no one would know without an audit.
Fact: Audits consistently reveal that approximately 25% of GA4 setups have significant data gaps due to broken tags or misconfigured consent modes. Decisions made on this data are decisions made on phantom numbers.
MEDIUM PRIORITY
3. Tracking What, Not How: Ignoring Behavioral Data
A bounce rate tells you that someone left. It doesn't tell you why, when, or at what point in the page experience they gave up. Businesses that don't segment behavioral data by device, traffic source, and user type are missing critical diagnostic signals.
Fact: 60% of web traffic in 2026 is mobile. Many businesses don't realize their mobile bounce rate is 2× higher than desktop because they're looking at blended averages instead of segmented data.
MEDIUM PRIORITY
4. Running GA4, GSC, and GMB as Isolated Reports
Each tool in isolation gives you data points. The customer journey view how a user moves from a Google search to a website visit to a conversion, is only visible when the tools are connected. Fragmented reporting means you're optimizing parts of a system without seeing the whole.
Fact: Companies that integrate cross-channel analytics data report 9× greater annual growth compared to those using fragmented, siloed tools.
MEDIUM PRIORITY
5. Ignoring Consent Mode v2 (This One Has Legal Consequences)
In 2026, Consent Mode v2 is not optional for businesses operating in GDPR-covered regions. Without it, Google is legally barred from modeling the behavior of users who decline cookie consent, creating a 40%+ gap in your reported conversions. This isn't just a data quality issue. It's a compliance risk.
A proper GTM implementation handles Consent Mode v2 automatically, maintaining data quality while keeping you legally protected.
How to Actually Set Up a High-Functioning Analytics System in 2026
A proper analytics setup isn't defined by the number of tools installed. It's defined by the speed at which it helps you make decisions. Here's the priority-ordered framework for building one from scratch or auditing and fixing what you already have.
1. Start with a Measurement Plan, Not a Tool
Before you touch GA4 or GTM, define what actions on your site represent real business intent. Not pageviews intent signals. Form starts. Pricing page visits. CTA clicks. Scroll depth on high-value content. These become your custom event schema. Everything else flows from this.
2. Build GTM as Your Site's Nervous System
Use GTM to deploy your GA4 config tag, all custom event triggers, and third-party pixels. Establish a clean data layer that connects your website with GA4, your ad platforms, and your CRM. Consider Server-Side GTM if page speed and Core Web Vitals are a priority, which they should be.
3. Configure GA4 Beyond the Defaults
Set up your custom event schema, enable predictive audiences (Purchase Probability and Churn Probability), configure Data-Driven Attribution to understand which touchpoints actually lead to conversion, and link GA4 to BigQuery on day one to avoid the 14-month data cliff.
4. Audit GSC for Indexing Gaps and CTR Bottlenecks
Check the Coverage report for pages that aren't indexed and shouldn't be excluded. Pull a filter for deep impressions + low CTR and treat those pages as immediate optimization targets. Review Core Web Vitals for any URLs flagged as "Poor" and prioritize fixing them.
5. Activate and Maintain Your GMB Profile
Keep GMB active with regular posts, updated photos, and consistent review responses. Monitor discovery search vs. branded search ratios. If discovery is growing, your local visibility is improving. If calls are high but website visits are low, local intent is strong, but your site isn't converting mobile traffic efficiently.
6. Implement Consent Mode v2 via GTM
Configure Consent Mode v2 in GTM to maintain legal compliance while preserving Google's ability to model conversion behavior for users who decline cookies. This is non-negotiable in 2026 for any business in a privacy-regulated market.
7. Connect All Four Tools into a Single Review Cadence
Set a regular cadence monthly at minimum to review GSC search queries alongside GA4 behavior data, GTM event accuracy, and GMB signals together. The goal is not a report. It's a decision: what gets fixed, optimized, or expanded next.
Analytics Is Not Reporting. It's Control.
The businesses that grow consistently in 2026 aren't the ones with the biggest ad budgets or the most traffic. They're the ones who understand what their data is actually telling them and who build systems to act on it before their competitors do.
GA4, GTM, Google Search Console, and Google Business Profile each give you a piece of the picture. The businesses winning in their categories use all four as an integrated feedback loop: one system that turns behavioral signals into strategic decisions, not monthly reports that get filed and forgotten.
Most businesses already have these tools installed. Very few have them properly configured, connected, and actively used. That gap is the opportunity.
Ready to Turn Your Analytics into a Growth System?
At c3digitus, we build analytics ecosystems that don't just collect data; they tell you what to do next. Free consultation available.